
Classification Metrics
Learning objectives
By the end of this notebook you will be able to:
Build and interpret a confusion matrix for binary and multi-class problems.
Compute precision, recall, F1-score, and explain when each matters.
Draw the ROC curve and compute AUC-ROC.
Draw the Precision-Recall curve and compute Average Precision (AUC-PR).
Explain why AUC-PR is preferred to AUC-ROC on imbalanced datasets.
Apply macro, micro, and weighted averaging for multi-class problems.
Choose the right metric for a given business problem.
Compute Matthews Correlation Coefficient as an alternative balanced metric.

Business hook — Which metric does the CEO care about?
A fraud detection team presents two models:
Model A: “We catch 80 % of frauds, but 1 in 4 flagged transactions is legitimate (lots of customer complaints).”
Model B: “We catch 50 % of frauds, but every flag is real.”
Model A has higher recall; Model B has perfect precision. Which do you deploy?
The answer depends on the business cost structure: false positives anger customers, false negatives lose money. Classification metrics are tools for having this conversation precisely.
1. The Confusion Matrix
Every binary prediction falls into one of four cells:
| Predicted Positive | Predicted Negative | |
|---|---|---|
| Actual Positive | True Positive (TP) | False Negative (FN) |
| Actual Negative | False Positive (FP) | True Negative (TN) |
From these four numbers we derive all classification metrics:
Business framing:
| Metric | Maximise when | Example |
|---|---|---|
| Precision | FP is costly | Spam filter (false alarm = deleted legit email) |
| Recall | FN is costly | Cancer screening (missed diagnosis = death) |
| F1 | Balance both | Churn prediction with moderate cost asymmetry |
| Accuracy | Classes are balanced | Character recognition on MNIST |
%matplotlib inline
import numpy as np
import matplotlib.pyplot as plt
from sklearn.datasets import make_classification
from sklearn.linear_model import LogisticRegression
from sklearn.model_selection import train_test_split
from sklearn.metrics import (confusion_matrix, classification_report,
precision_score, recall_score, f1_score, accuracy_score)
# Simulate churn dataset
X, y = make_classification(
n_samples=1000, n_features=10, n_informative=5,
weights=[0.8, 0.2], random_state=42
)
X_train, X_test, y_train, y_test = train_test_split(X, y, test_size=0.2, random_state=42, stratify=y)
m = LogisticRegression(class_weight='balanced', max_iter=1000, random_state=42)
m.fit(X_train, y_train)
y_pred = m.predict(X_test)
cm = confusion_matrix(y_test, y_pred)
tn, fp, fn, tp = cm.ravel()
print(f'TP={tp}, FP={fp}, FN={fn}, TN={tn}')
print(f'Precision: {precision_score(y_test, y_pred):.3f}')
print(f'Recall: {recall_score(y_test, y_pred):.3f}')
print(f'F1-score: {f1_score(y_test, y_pred):.3f}')
print(f'Accuracy: {accuracy_score(y_test, y_pred):.3f}')
print()
print(classification_report(y_test, y_pred, target_names=['Stay', 'Churn']))
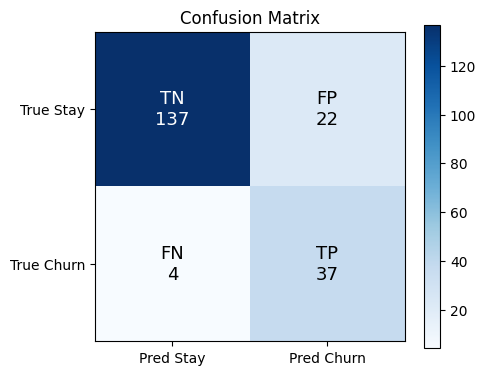
# Annotated confusion matrix
labels = np.array([[f'TN\n{tn}', f'FP\n{fp}'], [f'FN\n{fn}', f'TP\n{tp}']])
fig, ax = plt.subplots(figsize=(5, 4))
im = ax.imshow(cm, cmap='Blues')
for i in range(2):
for j in range(2):
ax.text(j, i, labels[i, j], ha='center', va='center', fontsize=13,
color='white' if cm[i, j] > cm.max()/2 else 'black')
ax.set_xticks([0, 1]); ax.set_yticks([0, 1])
ax.set_xticklabels(['Pred Stay', 'Pred Churn'])
ax.set_yticklabels(['True Stay', 'True Churn'])
ax.set_title('Confusion Matrix')
plt.colorbar(im)
plt.tight_layout()
plt.show()TP=37, FP=22, FN=4, TN=137
Precision: 0.627
Recall: 0.902
F1-score: 0.740
Accuracy: 0.870
precision recall f1-score support
Stay 0.97 0.86 0.91 159
Churn 0.63 0.90 0.74 41
accuracy 0.87 200
macro avg 0.80 0.88 0.83 200
weighted avg 0.90 0.87 0.88 200
/Volumes/MacSSD/01_Projects/Chandravesh-ML-Research/projects/jupyter-books/.venv/lib/python3.10/site-packages/sklearn/linear_model/_linear_loss.py:200: RuntimeWarning: divide by zero encountered in matmul
  raw_prediction = X @ weights + intercept
/Volumes/MacSSD/01_Projects/Chandravesh-ML-Research/projects/jupyter-books/.venv/lib/python3.10/site-packages/sklearn/linear_model/_linear_loss.py:200: RuntimeWarning: overflow encountered in matmul
  raw_prediction = X @ weights + intercept
/Volumes/MacSSD/01_Projects/Chandravesh-ML-Research/projects/jupyter-books/.venv/lib/python3.10/site-packages/sklearn/linear_model/_linear_loss.py:200: RuntimeWarning: invalid value encountered in matmul
  raw_prediction = X @ weights + intercept
/Volumes/MacSSD/01_Projects/Chandravesh-ML-Research/projects/jupyter-books/.venv/lib/python3.10/site-packages/sklearn/linear_model/_linear_loss.py:330: RuntimeWarning: divide by zero encountered in matmul
  grad[:n_features] = X.T @ grad_pointwise + l2_reg_strength * weights
/Volumes/MacSSD/01_Projects/Chandravesh-ML-Research/projects/jupyter-books/.venv/lib/python3.10/site-packages/sklearn/linear_model/_linear_loss.py:330: RuntimeWarning: overflow encountered in matmul
  grad[:n_features] = X.T @ grad_pointwise + l2_reg_strength * weights
/Volumes/MacSSD/01_Projects/Chandravesh-ML-Research/projects/jupyter-books/.venv/lib/python3.10/site-packages/sklearn/linear_model/_linear_loss.py:330: RuntimeWarning: invalid value encountered in matmul
  grad[:n_features] = X.T @ grad_pointwise + l2_reg_strength * weights
/Volumes/MacSSD/01_Projects/Chandravesh-ML-Research/projects/jupyter-books/.venv/lib/python3.10/site-packages/sklearn/utils/extmath.py:203: RuntimeWarning: divide by zero encountered in matmul
  ret = a @ b
/Volumes/MacSSD/01_Projects/Chandravesh-ML-Research/projects/jupyter-books/.venv/lib/python3.10/site-packages/sklearn/utils/extmath.py:203: RuntimeWarning: overflow encountered in matmul
  ret = a @ b
/Volumes/MacSSD/01_Projects/Chandravesh-ML-Research/projects/jupyter-books/.venv/lib/python3.10/site-packages/sklearn/utils/extmath.py:203: RuntimeWarning: invalid value encountered in matmul
  ret = a @ b
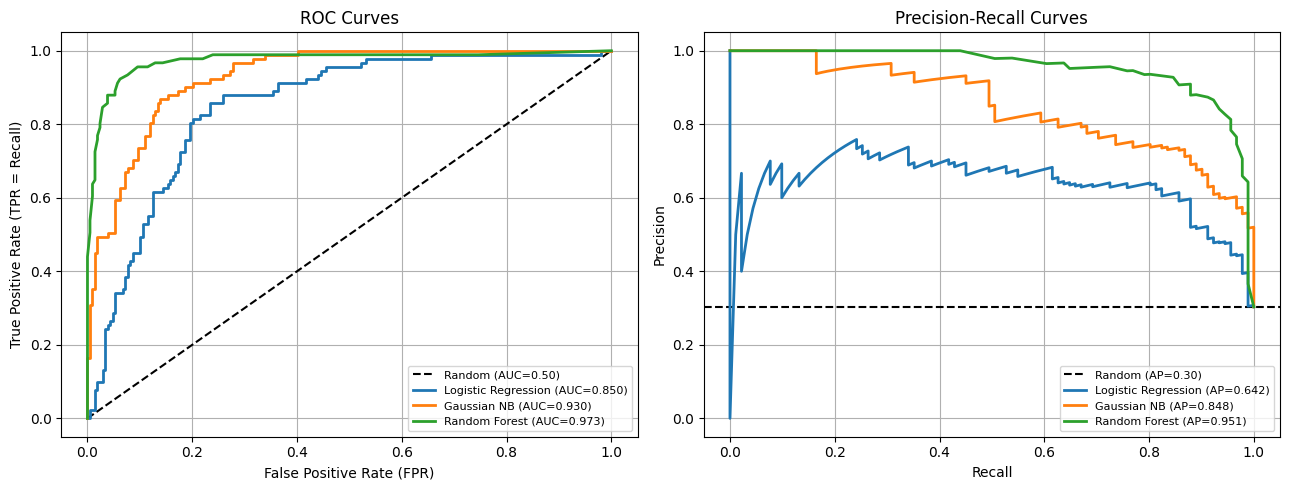
2. The ROC Curve and AUC-ROC
The ROC (Receiver Operating Characteristic) curve plots the trade-off between True Positive Rate (TPR = Recall) and False Positive Rate (FPR = FP/(FP+TN)) as the decision threshold varies from 0 to 1.
AUC-ROC (Area Under the ROC Curve):
AUC = 1.0: perfect separation of classes
AUC = 0.5: random classifier (diagonal line)
AUC < 0.5: worse than random (flip predictions)
Interpretation: AUC equals the probability that the model assigns a higher score to a randomly chosen positive example than a randomly chosen negative example.
%matplotlib inline
import numpy as np
import matplotlib.pyplot as plt
from sklearn.datasets import make_classification
from sklearn.linear_model import LogisticRegression
from sklearn.naive_bayes import GaussianNB
from sklearn.ensemble import RandomForestClassifier
from sklearn.model_selection import train_test_split
from sklearn.metrics import roc_curve, roc_auc_score, precision_recall_curve, average_precision_score

X, y = make_classification(
    n_samples=1000, n_features=10, n_informative=5,
    weights=[0.7, 0.3], random_state=42
)
X_train, X_test, y_train, y_test = train_test_split(X, y, test_size=0.3, random_state=42, stratify=y)

models = {
    'Logistic Regression': LogisticRegression(max_iter=1000, random_state=42),
    'Gaussian NB': GaussianNB(),
    'Random Forest': RandomForestClassifier(n_estimators=50, random_state=42),
}

fig, axes = plt.subplots(1, 2, figsize=(13, 5))

axes[0].plot([0, 1], [0, 1], 'k--', label='Random (AUC=0.50)')
for name, m in models.items():
    m.fit(X_train, y_train)
    probs = m.predict_proba(X_test)[:, 1]
    fpr, tpr, _ = roc_curve(y_test, probs)
    auc = roc_auc_score(y_test, probs)
    axes[0].plot(fpr, tpr, linewidth=2, label=f'{name} (AUC={auc:.3f})')

axes[0].set_xlabel('False Positive Rate (FPR)')
axes[0].set_ylabel('True Positive Rate (TPR = Recall)')
axes[0].set_title('ROC Curves')
axes[0].legend(fontsize=8)
axes[0].grid(True)

# PR curves
baseline_pr = y_test.mean()
axes[1].axhline(baseline_pr, color='k', linestyle='--', label=f'Random (AP={baseline_pr:.2f})')
for name, m in models.items():
    probs = m.predict_proba(X_test)[:, 1]
    prec, rec, _ = precision_recall_curve(y_test, probs)
    ap = average_precision_score(y_test, probs)
    axes[1].plot(rec, prec, linewidth=2, label=f'{name} (AP={ap:.3f})')

axes[1].set_xlabel('Recall')
axes[1].set_ylabel('Precision')
axes[1].set_title('Precision-Recall Curves')
axes[1].legend(fontsize=8)
axes[1].grid(True)

plt.tight_layout()
plt.show()
/Volumes/MacSSD/01_Projects/Chandravesh-ML-Research/projects/jupyter-books/.venv/lib/python3.10/site-packages/sklearn/linear_model/_linear_loss.py:200: RuntimeWarning: divide by zero encountered in matmul
raw_prediction = X @ weights + intercept
/Volumes/MacSSD/01_Projects/Chandravesh-ML-Research/projects/jupyter-books/.venv/lib/python3.10/site-packages/sklearn/linear_model/_linear_loss.py:200: RuntimeWarning: overflow encountered in matmul
raw_prediction = X @ weights + intercept
/Volumes/MacSSD/01_Projects/Chandravesh-ML-Research/projects/jupyter-books/.venv/lib/python3.10/site-packages/sklearn/linear_model/_linear_loss.py:200: RuntimeWarning: invalid value encountered in matmul
raw_prediction = X @ weights + intercept
/Volumes/MacSSD/01_Projects/Chandravesh-ML-Research/projects/jupyter-books/.venv/lib/python3.10/site-packages/sklearn/linear_model/_linear_loss.py:330: RuntimeWarning: divide by zero encountered in matmul
grad[:n_features] = X.T @ grad_pointwise + l2_reg_strength * weights
/Volumes/MacSSD/01_Projects/Chandravesh-ML-Research/projects/jupyter-books/.venv/lib/python3.10/site-packages/sklearn/linear_model/_linear_loss.py:330: RuntimeWarning: overflow encountered in matmul
grad[:n_features] = X.T @ grad_pointwise + l2_reg_strength * weights
/Volumes/MacSSD/01_Projects/Chandravesh-ML-Research/projects/jupyter-books/.venv/lib/python3.10/site-packages/sklearn/linear_model/_linear_loss.py:330: RuntimeWarning: invalid value encountered in matmul
grad[:n_features] = X.T @ grad_pointwise + l2_reg_strength * weights
/Volumes/MacSSD/01_Projects/Chandravesh-ML-Research/projects/jupyter-books/.venv/lib/python3.10/site-packages/sklearn/utils/extmath.py:203: RuntimeWarning: divide by zero encountered in matmul
ret = a @ b
/Volumes/MacSSD/01_Projects/Chandravesh-ML-Research/projects/jupyter-books/.venv/lib/python3.10/site-packages/sklearn/utils/extmath.py:203: RuntimeWarning: overflow encountered in matmul
ret = a @ b
/Volumes/MacSSD/01_Projects/Chandravesh-ML-Research/projects/jupyter-books/.venv/lib/python3.10/site-packages/sklearn/utils/extmath.py:203: RuntimeWarning: invalid value encountered in matmul
ret = a @ b
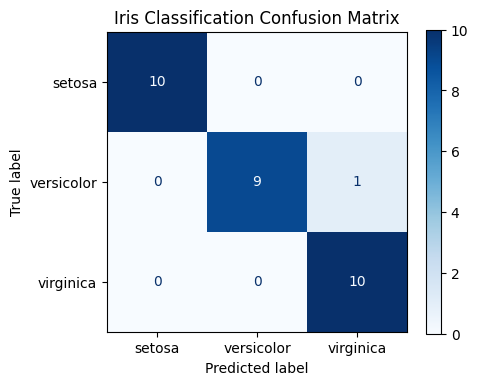
3. Multi-Class Metrics — Macro, Micro, Weighted Averaging
For classes, we need to aggregate per-class metrics into a single number.
Macro averaging: compute metric for each class independently, then take the unweighted mean. Treats all classes equally — sensitive to rare class performance.
Micro averaging: pool all TP, FP, FN across classes before computing the metric. Dominated by frequent classes.
Weighted averaging: weight each class metric by its support (number of true instances). Best for imbalanced multi-class.
| Averaging | Favours | Use when |
|---|---|---|
| Macro | Rare classes | All classes matter equally |
| Micro | Frequent classes | Overall accuracy-like metric |
| Weighted | Proportional | Class imbalance, reporting to stakeholders |
%matplotlib inline
import numpy as np
import matplotlib.pyplot as plt
from sklearn.datasets import load_iris, make_classification
from sklearn.linear_model import LogisticRegression
from sklearn.model_selection import train_test_split
from sklearn.metrics import (classification_report, confusion_matrix,
f1_score, ConfusionMatrixDisplay)
iris = load_iris()
X_train, X_test, y_train, y_test = train_test_split(
iris.data, iris.target, test_size=0.2, random_state=42, stratify=iris.target
)
m = LogisticRegression(max_iter=1000, random_state=42)
m.fit(X_train, y_train)
y_pred = m.predict(X_test)
print(classification_report(y_test, y_pred, target_names=iris.target_names))
f1_macro = f1_score(y_test, y_pred, average='macro')
f1_micro = f1_score(y_test, y_pred, average='micro')
f1_weighted = f1_score(y_test, y_pred, average='weighted')
print(f'F1 macro: {f1_macro:.4f}')
print(f'F1 micro: {f1_micro:.4f}')
print(f'F1 weighted: {f1_weighted:.4f}')
fig, ax = plt.subplots(figsize=(5, 4))
ConfusionMatrixDisplay.from_predictions(
y_test, y_pred, display_labels=iris.target_names,
cmap='Blues', ax=ax
)
ax.set_title('Iris Classification Confusion Matrix')
plt.tight_layout()
plt.show() precision recall f1-score support
setosa 1.00 1.00 1.00 10
versicolor 1.00 0.90 0.95 10
virginica 0.91 1.00 0.95 10
accuracy 0.97 30
macro avg 0.97 0.97 0.97 30
weighted avg 0.97 0.97 0.97 30
F1 macro: 0.9666
F1 micro: 0.9667
F1 weighted: 0.9666
4. Matthews Correlation Coefficient
MCC is a balanced metric that works well even for extreme class imbalance:
MCC = +1: perfect prediction
MCC = 0: random classifier
MCC = -1: perfectly wrong
Unlike F1, MCC considers all four confusion matrix cells. It is considered the most informative single metric for binary classification by many ML practitioners.
Metric selection guide:
| Situation | Recommended metric |
|---|---|
| Balanced classes, all errors equal | Accuracy, F1 macro |
| High FP cost (spam, fraud alerts) | Precision |
| High FN cost (cancer screening, fraud loss) | Recall |
| Balanced FP/FN cost | F1 |
| Severe imbalance (< 1 % positive) | AUC-PR, MCC |
| Probability ranking needed | AUC-ROC, AUC-PR |
| Multi-class, all classes matter | F1 macro, MCC |
%matplotlib inline
import numpy as np
import matplotlib.pyplot as plt
from sklearn.datasets import make_classification
from sklearn.linear_model import LogisticRegression
from sklearn.model_selection import train_test_split
from sklearn.metrics import matthews_corrcoef, f1_score, roc_auc_score, average_precision_score
# Compare metrics on varying imbalance ratios
imbalance_ratios = [0.5, 0.3, 0.1, 0.05, 0.02]
results = {'MCC': [], 'F1': [], 'AUC-ROC': [], 'AUC-PR': []}
for ratio in imbalance_ratios:
X, y = make_classification(
n_samples=2000, n_features=10, n_informative=5,
weights=[1 - ratio, ratio], random_state=42
)
X_tr, X_te, y_tr, y_te = train_test_split(X, y, test_size=0.2, random_state=42, stratify=y)
m = LogisticRegression(class_weight='balanced', max_iter=1000, random_state=42)
m.fit(X_tr, y_tr)
y_pred = m.predict(X_te)
probs = m.predict_proba(X_te)[:, 1]
results['MCC'].append(matthews_corrcoef(y_te, y_pred))
results['F1'].append(f1_score(y_te, y_pred, zero_division=0))
results['AUC-ROC'].append(roc_auc_score(y_te, probs))
results['AUC-PR'].append(average_precision_score(y_te, probs))
plt.figure(figsize=(9, 4))
for metric, vals in results.items():
plt.plot([int(r*100) for r in imbalance_ratios], vals, marker='o', linewidth=2, label=metric)
plt.xlabel('Positive class %')
plt.ylabel('Score')
plt.title('Metric Behaviour vs Class Imbalance (balanced class_weight, LR)')
plt.legend()
plt.grid(True)
plt.tight_layout()
plt.show()
print('\nMetrics at 2% positive class:')
for metric, vals in results.items():
print(f' {metric}: {vals[-1]:.3f}')/Volumes/MacSSD/01_Projects/Chandravesh-ML-Research/projects/jupyter-books/.venv/lib/python3.10/site-packages/sklearn/linear_model/_linear_loss.py:200: RuntimeWarning: divide by zero encountered in matmul
raw_prediction = X @ weights + intercept
/Volumes/MacSSD/01_Projects/Chandravesh-ML-Research/projects/jupyter-books/.venv/lib/python3.10/site-packages/sklearn/linear_model/_linear_loss.py:200: RuntimeWarning: overflow encountered in matmul
raw_prediction = X @ weights + intercept
/Volumes/MacSSD/01_Projects/Chandravesh-ML-Research/projects/jupyter-books/.venv/lib/python3.10/site-packages/sklearn/linear_model/_linear_loss.py:200: RuntimeWarning: invalid value encountered in matmul
raw_prediction = X @ weights + intercept
/Volumes/MacSSD/01_Projects/Chandravesh-ML-Research/projects/jupyter-books/.venv/lib/python3.10/site-packages/sklearn/linear_model/_linear_loss.py:330: RuntimeWarning: divide by zero encountered in matmul
grad[:n_features] = X.T @ grad_pointwise + l2_reg_strength * weights
/Volumes/MacSSD/01_Projects/Chandravesh-ML-Research/projects/jupyter-books/.venv/lib/python3.10/site-packages/sklearn/linear_model/_linear_loss.py:330: RuntimeWarning: overflow encountered in matmul
grad[:n_features] = X.T @ grad_pointwise + l2_reg_strength * weights
/Volumes/MacSSD/01_Projects/Chandravesh-ML-Research/projects/jupyter-books/.venv/lib/python3.10/site-packages/sklearn/linear_model/_linear_loss.py:330: RuntimeWarning: invalid value encountered in matmul
grad[:n_features] = X.T @ grad_pointwise + l2_reg_strength * weights
/Volumes/MacSSD/01_Projects/Chandravesh-ML-Research/projects/jupyter-books/.venv/lib/python3.10/site-packages/sklearn/utils/extmath.py:203: RuntimeWarning: divide by zero encountered in matmul
ret = a @ b
/Volumes/MacSSD/01_Projects/Chandravesh-ML-Research/projects/jupyter-books/.venv/lib/python3.10/site-packages/sklearn/utils/extmath.py:203: RuntimeWarning: overflow encountered in matmul
ret = a @ b
/Volumes/MacSSD/01_Projects/Chandravesh-ML-Research/projects/jupyter-books/.venv/lib/python3.10/site-packages/sklearn/utils/extmath.py:203: RuntimeWarning: invalid value encountered in matmul
ret = a @ b
/Volumes/MacSSD/01_Projects/Chandravesh-ML-Research/projects/jupyter-books/.venv/lib/python3.10/site-packages/sklearn/utils/extmath.py:203: RuntimeWarning: divide by zero encountered in matmul
ret = a @ b
/Volumes/MacSSD/01_Projects/Chandravesh-ML-Research/projects/jupyter-books/.venv/lib/python3.10/site-packages/sklearn/utils/extmath.py:203: RuntimeWarning: overflow encountered in matmul
ret = a @ b
/Volumes/MacSSD/01_Projects/Chandravesh-ML-Research/projects/jupyter-books/.venv/lib/python3.10/site-packages/sklearn/utils/extmath.py:203: RuntimeWarning: invalid value encountered in matmul
ret = a @ b
/Volumes/MacSSD/01_Projects/Chandravesh-ML-Research/projects/jupyter-books/.venv/lib/python3.10/site-packages/sklearn/linear_model/_linear_loss.py:200: RuntimeWarning: divide by zero encountered in matmul
  raw_prediction = X @ weights + intercept
/Volumes/MacSSD/01_Projects/Chandravesh-ML-Research/projects/jupyter-books/.venv/lib/python3.10/site-packages/sklearn/linear_model/_linear_loss.py:200: RuntimeWarning: overflow encountered in matmul
  raw_prediction = X @ weights + intercept
/Volumes/MacSSD/01_Projects/Chandravesh-ML-Research/projects/jupyter-books/.venv/lib/python3.10/site-packages/sklearn/linear_model/_linear_loss.py:200: RuntimeWarning: invalid value encountered in matmul
  raw_prediction = X @ weights + intercept
/Volumes/MacSSD/01_Projects/Chandravesh-ML-Research/projects/jupyter-books/.venv/lib/python3.10/site-packages/sklearn/linear_model/_linear_loss.py:330: RuntimeWarning: divide by zero encountered in matmul
  grad[:n_features] = X.T @ grad_pointwise + l2_reg_strength * weights
/Volumes/MacSSD/01_Projects/Chandravesh-ML-Research/projects/jupyter-books/.venv/lib/python3.10/site-packages/sklearn/linear_model/_linear_loss.py:330: RuntimeWarning: overflow encountered in matmul
  grad[:n_features] = X.T @ grad_pointwise + l2_reg_strength * weights
/Volumes/MacSSD/01_Projects/Chandravesh-ML-Research/projects/jupyter-books/.venv/lib/python3.10/site-packages/sklearn/linear_model/_linear_loss.py:330: RuntimeWarning: invalid value encountered in matmul
  grad[:n_features] = X.T @ grad_pointwise + l2_reg_strength * weights
/Volumes/MacSSD/01_Projects/Chandravesh-ML-Research/projects/jupyter-books/.venv/lib/python3.10/site-packages/sklearn/utils/extmath.py:203: RuntimeWarning: divide by zero encountered in matmul
  ret = a @ b
/Volumes/MacSSD/01_Projects/Chandravesh-ML-Research/projects/jupyter-books/.venv/lib/python3.10/site-packages/sklearn/utils/extmath.py:203: RuntimeWarning: overflow encountered in matmul
  ret = a @ b
/Volumes/MacSSD/01_Projects/Chandravesh-ML-Research/projects/jupyter-books/.venv/lib/python3.10/site-packages/sklearn/utils/extmath.py:203: RuntimeWarning: invalid value encountered in matmul
  ret = a @ b
/Volumes/MacSSD/01_Projects/Chandravesh-ML-Research/projects/jupyter-books/.venv/lib/python3.10/site-packages/sklearn/linear_model/_linear_loss.py:200: RuntimeWarning: divide by zero encountered in matmul
raw_prediction = X @ weights + intercept
/Volumes/MacSSD/01_Projects/Chandravesh-ML-Research/projects/jupyter-books/.venv/lib/python3.10/site-packages/sklearn/linear_model/_linear_loss.py:200: RuntimeWarning: overflow encountered in matmul
raw_prediction = X @ weights + intercept
/Volumes/MacSSD/01_Projects/Chandravesh-ML-Research/projects/jupyter-books/.venv/lib/python3.10/site-packages/sklearn/linear_model/_linear_loss.py:200: RuntimeWarning: invalid value encountered in matmul
raw_prediction = X @ weights + intercept
/Volumes/MacSSD/01_Projects/Chandravesh-ML-Research/projects/jupyter-books/.venv/lib/python3.10/site-packages/sklearn/linear_model/_linear_loss.py:330: RuntimeWarning: divide by zero encountered in matmul
grad[:n_features] = X.T @ grad_pointwise + l2_reg_strength * weights
/Volumes/MacSSD/01_Projects/Chandravesh-ML-Research/projects/jupyter-books/.venv/lib/python3.10/site-packages/sklearn/linear_model/_linear_loss.py:330: RuntimeWarning: overflow encountered in matmul
grad[:n_features] = X.T @ grad_pointwise + l2_reg_strength * weights
/Volumes/MacSSD/01_Projects/Chandravesh-ML-Research/projects/jupyter-books/.venv/lib/python3.10/site-packages/sklearn/linear_model/_linear_loss.py:330: RuntimeWarning: invalid value encountered in matmul
grad[:n_features] = X.T @ grad_pointwise + l2_reg_strength * weights
/Volumes/MacSSD/01_Projects/Chandravesh-ML-Research/projects/jupyter-books/.venv/lib/python3.10/site-packages/sklearn/utils/extmath.py:203: RuntimeWarning: divide by zero encountered in matmul
ret = a @ b
/Volumes/MacSSD/01_Projects/Chandravesh-ML-Research/projects/jupyter-books/.venv/lib/python3.10/site-packages/sklearn/utils/extmath.py:203: RuntimeWarning: overflow encountered in matmul
ret = a @ b
/Volumes/MacSSD/01_Projects/Chandravesh-ML-Research/projects/jupyter-books/.venv/lib/python3.10/site-packages/sklearn/utils/extmath.py:203: RuntimeWarning: invalid value encountered in matmul
ret = a @ b
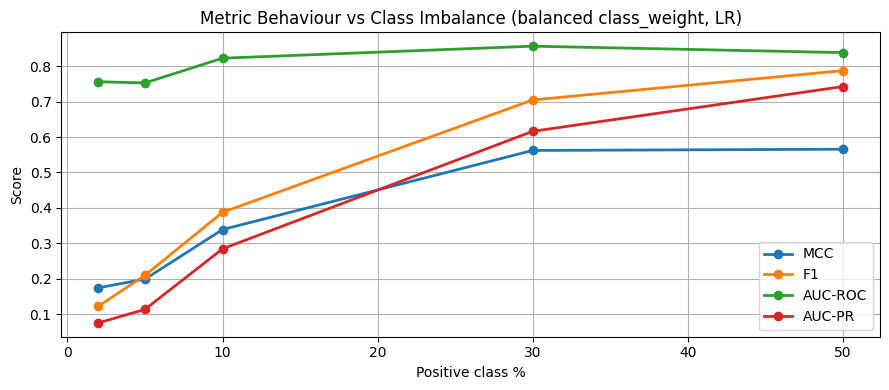
Metrics at 2% positive class:
  MCC: 0.175
  F1: 0.123
  AUC-ROC: 0.756
  AUC-PR: 0.076
5. Try It in the Browser
Compute all classification metrics from a confusion matrix in pure Python.
import math

# Confusion matrix values
TP, FP, FN, TN = 45, 12, 8, 135

total = TP + FP + FN + TN
accuracy  = (TP + TN) / total
precision = TP / (TP + FP) if (TP + FP) > 0 else 0.0
recall    = TP / (TP + FN) if (TP + FN) > 0 else 0.0
f1        = 2 * precision * recall / (precision + recall) if (precision + recall) > 0 else 0.0
specificity = TN / (TN + FP) if (TN + FP) > 0 else 0.0

# MCC
denom = math.sqrt((TP+FP)*(TP+FN)*(TN+FP)*(TN+FN))
mcc = (TP*TN - FP*FN) / denom if denom > 0 else 0.0

print(f'Confusion matrix: TP={TP}, FP={FP}, FN={FN}, TN={TN}')
print(f'Accuracy:    {accuracy:.3f}')
print(f'Precision:   {precision:.3f}  (of predicted positives, {precision:.1%} are real)')
print(f'Recall:      {recall:.3f}  (caught {recall:.1%} of actual positives)')
print(f'Specificity: {specificity:.3f}  (correctly rejected {specificity:.1%} of negatives)')
print(f'F1 score:    {f1:.3f}')
print(f'MCC:         {mcc:.3f}')
Knowledge Check
Which metric is especially useful when false positives are costly?
Why is recall important in tasks like fraud detection or disease screening?
Why is AUC-PR preferred to AUC-ROC on severely imbalanced datasets?
When reporting F1 for a 3-class problem where rare classes matter equally, which averaging should you use?
Exercises
Exercise 1 — Metric at Different Thresholds
Using the logistic regression model from the confusion matrix cell, compute precision, recall, F1, and MCC at thresholds 0.3, 0.5, 0.7. How does the trade-off change? Build a table.
%matplotlib inline
# Exercise 1: metrics at multiple thresholds
# Your code here
Exercise 2 — ROC vs PR on Extreme Imbalance
Generate two datasets: one with 30 % positive class and one with 2 % positive class. For a logistic regression model, plot both the ROC curve and PR curve for each. Show how AUC-ROC stays high while AUC-PR drops dramatically on the 2 % dataset.
%matplotlib inline
# Exercise 2: ROC vs PR on imbalanced data
# Your code here
Common Pitfalls
Summary
Confusion matrix: 4 cells (TP, FP, FN, TN) underlie all binary metrics.
Precision = TP/(TP+FP): use when FP is costly. Recall = TP/(TP+FN): use when FN is costly. F1: harmonic mean of both.
ROC curve: TPR vs FPR as threshold varies; AUC = probability that positive ranks above negative.
PR curve: Precision vs Recall; Average Precision = area under curve; preferred for rare positive class.
Multi-class averaging: macro = unweighted mean (rare classes matter equally); micro = pooled; weighted = frequency-proportional.
MCC: considers all four cells; most informative single number for binary classification.

What’s Next?
You now have the complete evaluation toolkit for classification. In classification_lab.ipynb you will apply logistic regression, Naive Bayes, and all the metrics you have learned to a real churn prediction problem — from raw data to a business-ready model evaluation report.
Coming up:
Lab — Churn Prediction: EDA, feature engineering, model comparison, threshold selection
SVM Basics — max-margin intuition and the support vector formulation
Kernel SVMs — RBF and polynomial kernels for non-linear boundaries