
Lab — Customer Segmentation with KNN
What you will build: an end-to-end customer segmentation pipeline using RFM features (Recency, Frequency, Monetary), KNN-based similarity search, K-Means clustering for segment labels, and business interpretation of each segment.

Business Context — Targeted Marketing via Segmentation
A retail chain has 10,000 customers but only budget to personalise 3 campaigns. By segmenting customers into behavioural groups using RFM analysis + KNN similarity, the marketing team can:
Target Champions (high-value recent buyers) with loyalty rewards
Re-engage At-Risk customers (formerly high-value, now lapsing)
Upsell Potential Loyalists (frequent but low spend)
Dataset: synthetic retail transaction data (10,000 customers, 50,000 transactions).
1. Generate and Explore the Dataset
%matplotlib inline
import numpy as np
import pandas as pd
import matplotlib.pyplot as plt
from datetime import datetime, timedelta

np.random.seed(42)

# Synthetic transaction data
n_customers = 2000
n_transactions = 15000
snapshot_date = datetime(2024, 12, 31)

customer_ids = np.arange(1, n_customers + 1)
# Different customer archetypes
archetype = np.random.choice(['champion', 'at_risk', 'potential', 'lost'],
                               size=n_customers, p=[0.15, 0.20, 0.35, 0.30])

transactions = []
for cid, arch in zip(customer_ids, archetype):
    if arch == 'champion':
        n_tx = np.random.randint(15, 40)
        recency_days = np.random.randint(1, 30)
        spend_per_tx = np.random.uniform(80, 300)
    elif arch == 'at_risk':
        n_tx = np.random.randint(8, 20)
        recency_days = np.random.randint(60, 180)
        spend_per_tx = np.random.uniform(50, 200)
    elif arch == 'potential':
        n_tx = np.random.randint(4, 12)
        recency_days = np.random.randint(10, 60)
        spend_per_tx = np.random.uniform(20, 80)
    else:  # lost
        n_tx = np.random.randint(1, 5)
        recency_days = np.random.randint(180, 365)
        spend_per_tx = np.random.uniform(10, 50)
    last_date = snapshot_date - timedelta(days=recency_days)
    for _ in range(n_tx):
        tx_date = last_date - timedelta(days=np.random.randint(0, 365))
        transactions.append({'customer_id': cid, 'date': tx_date,
                               'amount': spend_per_tx * np.random.uniform(0.7, 1.3),
                               'archetype': arch})

df = pd.DataFrame(transactions)
print(f"Transactions: {len(df):,}")
print(f"Customers:    {df['customer_id'].nunique():,}")
print(f"Date range:   {df['date'].min().date()} → {df['date'].max().date()}")
print(f"\nArchetype breakdown:")
print(df.groupby('archetype')['customer_id'].nunique().rename('n_customers').to_string())
Transactions: 20,334
Customers:    2,000
Date range:   2023-01-09 → 2024-12-30

Archetype breakdown:
archetype
at_risk      382
champion     323
lost         595
potential    700
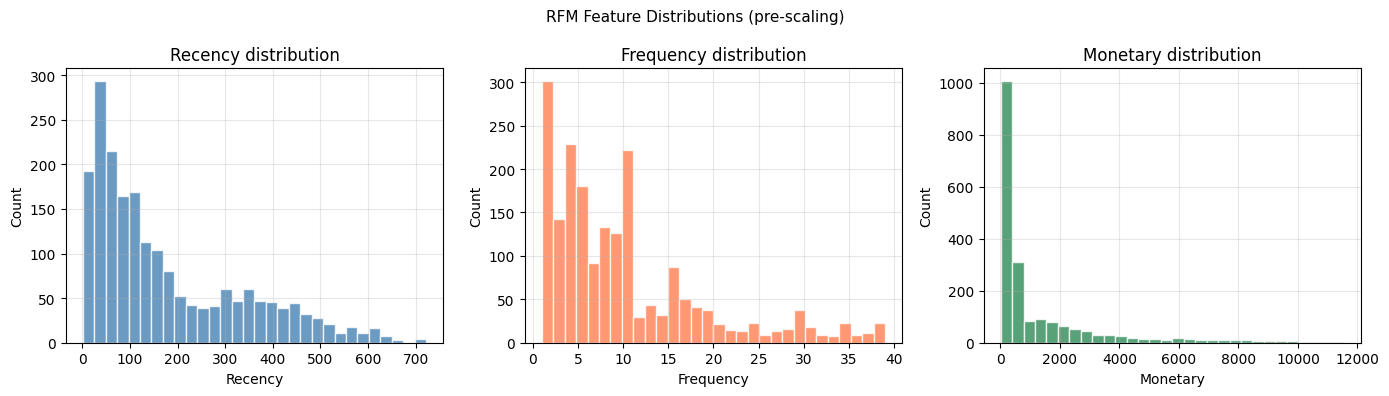
2. RFM Feature Engineering
RFM is the standard framework for customer behavioural analysis:
— Recency: days since last purchase (lower = better)
— Frequency: number of transactions in the period
— Monetary: total spend in the period
%matplotlib inline
import numpy as np
import pandas as pd
import matplotlib.pyplot as plt
from datetime import datetime

snapshot_date = datetime(2024, 12, 31)

rfm = df.groupby('customer_id').agg(
    recency=('date', lambda x: (snapshot_date - x.max()).days),
    frequency=('date', 'count'),
    monetary=('amount', 'sum'),
    archetype=('archetype', 'first')
).reset_index()

print("RFM summary:")
print(rfm[['recency','frequency','monetary']].describe().round(1))

# Distribution plots
fig, axes = plt.subplots(1, 3, figsize=(14, 4))
for ax, col, color in zip(axes, ['recency', 'frequency', 'monetary'], ['steelblue','coral','seagreen']):
    ax.hist(rfm[col], bins=30, color=color, edgecolor='white', alpha=0.8)
    ax.set_xlabel(col.capitalize())
    ax.set_ylabel('Count')
    ax.set_title(f'{col.capitalize()} distribution')
    ax.grid(alpha=0.3)
plt.suptitle('RFM Feature Distributions (pre-scaling)', fontsize=11)
plt.tight_layout()
plt.show()
RFM summary:
       recency  frequency  monetary
count   2000.0     2000.0    2000.0
mean     177.4       10.2    1311.1
std      159.2        8.8    2070.2
min        1.0        1.0       8.3
25%       51.0        4.0     114.9
50%      116.0        8.0     391.1
75%      286.0       13.0    1582.5
max      722.0       39.0   11546.0
3. Scale Features and Segment with K-Means
RFM values span very different ranges — we scale before clustering and before KNN similarity search.
%matplotlib inline
import numpy as np
import matplotlib.pyplot as plt
from sklearn.preprocessing import StandardScaler
from sklearn.cluster import KMeans
from sklearn.metrics import silhouette_score

X_rfm = rfm[['recency', 'frequency', 'monetary']].values
scaler = StandardScaler()
X_scaled = scaler.fit_transform(X_rfm)

# Elbow + silhouette to choose K
inertias, sil_scores = [], []
K_range = range(2, 9)
for k in K_range:
    km = KMeans(n_clusters=k, random_state=42, n_init=10)
    labels = km.fit_predict(X_scaled)
    inertias.append(km.inertia_)
    sil_scores.append(silhouette_score(X_scaled, labels))

fig, axes = plt.subplots(1, 2, figsize=(12, 4))
axes[0].plot(list(K_range), inertias, 'b-o')
axes[0].set_xlabel('K'); axes[0].set_ylabel('Inertia (within-cluster SS)')
axes[0].set_title('Elbow Method'); axes[0].grid(alpha=0.3)

axes[1].plot(list(K_range), sil_scores, 'r-o')
axes[1].set_xlabel('K'); axes[1].set_ylabel('Silhouette Score')
axes[1].set_title('Silhouette Score'); axes[1].grid(alpha=0.3)
best_k = list(K_range)[np.argmax(sil_scores)]
axes[1].axvline(best_k, color='k', linestyle='--', label=f'Best K={best_k}')
axes[1].legend()

plt.tight_layout()
plt.show()
print(f"Best K by silhouette: {best_k}  (score={max(sil_scores):.3f})")
/Volumes/MacSSD/01_Projects/Chandravesh-ML-Research/projects/jupyter-books/.venv/lib/python3.10/site-packages/sklearn/utils/extmath.py:203: RuntimeWarning: divide by zero encountered in matmul
  ret = a @ b
/Volumes/MacSSD/01_Projects/Chandravesh-ML-Research/projects/jupyter-books/.venv/lib/python3.10/site-packages/sklearn/utils/extmath.py:203: RuntimeWarning: overflow encountered in matmul
  ret = a @ b
/Volumes/MacSSD/01_Projects/Chandravesh-ML-Research/projects/jupyter-books/.venv/lib/python3.10/site-packages/sklearn/utils/extmath.py:203: RuntimeWarning: invalid value encountered in matmul
  ret = a @ b
/Volumes/MacSSD/01_Projects/Chandravesh-ML-Research/projects/jupyter-books/.venv/lib/python3.10/site-packages/sklearn/cluster/_kmeans.py:237: RuntimeWarning: divide by zero encountered in matmul
  current_pot = closest_dist_sq @ sample_weight
/Volumes/MacSSD/01_Projects/Chandravesh-ML-Research/projects/jupyter-books/.venv/lib/python3.10/site-packages/sklearn/cluster/_kmeans.py:237: RuntimeWarning: overflow encountered in matmul
  current_pot = closest_dist_sq @ sample_weight
/Volumes/MacSSD/01_Projects/Chandravesh-ML-Research/projects/jupyter-books/.venv/lib/python3.10/site-packages/sklearn/cluster/_kmeans.py:237: RuntimeWarning: invalid value encountered in matmul
  current_pot = closest_dist_sq @ sample_weight
/Volumes/MacSSD/01_Projects/Chandravesh-ML-Research/projects/jupyter-books/.venv/lib/python3.10/site-packages/sklearn/utils/extmath.py:203: RuntimeWarning: divide by zero encountered in matmul
  ret = a @ b
/Volumes/MacSSD/01_Projects/Chandravesh-ML-Research/projects/jupyter-books/.venv/lib/python3.10/site-packages/sklearn/utils/extmath.py:203: RuntimeWarning: overflow encountered in matmul
  ret = a @ b
/Volumes/MacSSD/01_Projects/Chandravesh-ML-Research/projects/jupyter-books/.venv/lib/python3.10/site-packages/sklearn/utils/extmath.py:203: RuntimeWarning: invalid value encountered in matmul
  ret = a @ b
/Volumes/MacSSD/01_Projects/Chandravesh-ML-Research/projects/jupyter-books/.venv/lib/python3.10/site-packages/sklearn/cluster/_kmeans.py:237: RuntimeWarning: divide by zero encountered in matmul
  current_pot = closest_dist_sq @ sample_weight
/Volumes/MacSSD/01_Projects/Chandravesh-ML-Research/projects/jupyter-books/.venv/lib/python3.10/site-packages/sklearn/cluster/_kmeans.py:237: RuntimeWarning: overflow encountered in matmul
  current_pot = closest_dist_sq @ sample_weight
/Volumes/MacSSD/01_Projects/Chandravesh-ML-Research/projects/jupyter-books/.venv/lib/python3.10/site-packages/sklearn/cluster/_kmeans.py:237: RuntimeWarning: invalid value encountered in matmul
  current_pot = closest_dist_sq @ sample_weight
/Volumes/MacSSD/01_Projects/Chandravesh-ML-Research/projects/jupyter-books/.venv/lib/python3.10/site-packages/sklearn/utils/extmath.py:203: RuntimeWarning: divide by zero encountered in matmul
  ret = a @ b
/Volumes/MacSSD/01_Projects/Chandravesh-ML-Research/projects/jupyter-books/.venv/lib/python3.10/site-packages/sklearn/utils/extmath.py:203: RuntimeWarning: overflow encountered in matmul
  ret = a @ b
/Volumes/MacSSD/01_Projects/Chandravesh-ML-Research/projects/jupyter-books/.venv/lib/python3.10/site-packages/sklearn/utils/extmath.py:203: RuntimeWarning: invalid value encountered in matmul
  ret = a @ b
/Volumes/MacSSD/01_Projects/Chandravesh-ML-Research/projects/jupyter-books/.venv/lib/python3.10/site-packages/sklearn/cluster/_kmeans.py:237: RuntimeWarning: divide by zero encountered in matmul
  current_pot = closest_dist_sq @ sample_weight
/Volumes/MacSSD/01_Projects/Chandravesh-ML-Research/projects/jupyter-books/.venv/lib/python3.10/site-packages/sklearn/cluster/_kmeans.py:237: RuntimeWarning: overflow encountered in matmul
  current_pot = closest_dist_sq @ sample_weight
/Volumes/MacSSD/01_Projects/Chandravesh-ML-Research/projects/jupyter-books/.venv/lib/python3.10/site-packages/sklearn/cluster/_kmeans.py:237: RuntimeWarning: invalid value encountered in matmul
  current_pot = closest_dist_sq @ sample_weight
/Volumes/MacSSD/01_Projects/Chandravesh-ML-Research/projects/jupyter-books/.venv/lib/python3.10/site-packages/sklearn/utils/extmath.py:203: RuntimeWarning: divide by zero encountered in matmul
  ret = a @ b
/Volumes/MacSSD/01_Projects/Chandravesh-ML-Research/projects/jupyter-books/.venv/lib/python3.10/site-packages/sklearn/utils/extmath.py:203: RuntimeWarning: overflow encountered in matmul
  ret = a @ b
/Volumes/MacSSD/01_Projects/Chandravesh-ML-Research/projects/jupyter-books/.venv/lib/python3.10/site-packages/sklearn/utils/extmath.py:203: RuntimeWarning: invalid value encountered in matmul
  ret = a @ b
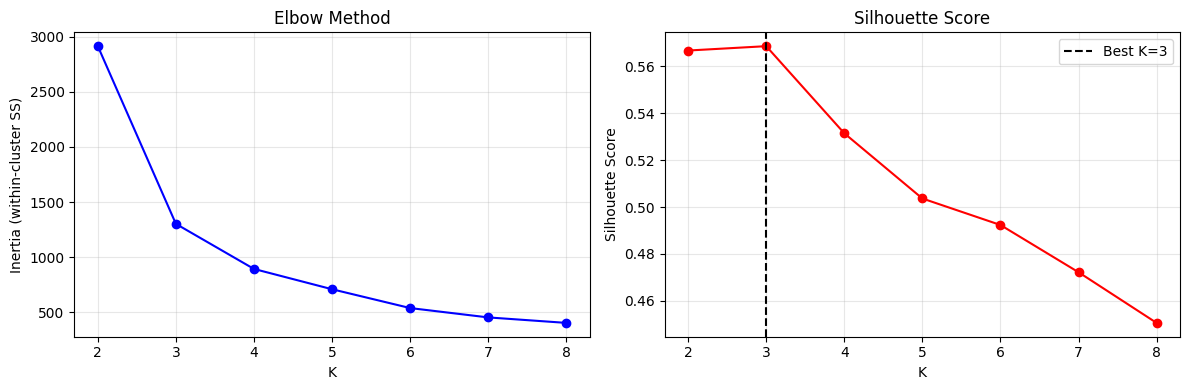
Best K by silhouette: 3 (score=0.569)
%matplotlib inline
import numpy as np
import pandas as pd
import matplotlib.pyplot as plt
from sklearn.cluster import KMeans

best_k = 4  # Use 4 for clear business interpretation
km = KMeans(n_clusters=best_k, random_state=42, n_init=10)
rfm['segment'] = km.fit_predict(X_scaled)

# Profile each segment
profile = rfm.groupby('segment')[['recency', 'frequency', 'monetary']].mean().round(1)
profile['count'] = rfm.groupby('segment').size()
profile = profile.sort_values('monetary', ascending=False)
print("Segment profiles:")
print(profile.to_string())

# Assign business names based on profile
seg_names = {}
sorted_segs = profile.index.tolist()
seg_names[sorted_segs[0]] = 'Champions'
seg_names[sorted_segs[1]] = 'Loyal Customers'
seg_names[sorted_segs[2]] = 'At-Risk'
seg_names[sorted_segs[3]] = 'Lost / Inactive'
rfm['segment_name'] = rfm['segment'].map(seg_names)

# 2D scatter: Recency vs Monetary (colour = segment)
fig, ax = plt.subplots(figsize=(9, 6))
colors = ['gold', 'steelblue', 'coral', 'gray']
for (sname, grp), c in zip(rfm.groupby('segment_name'), colors):
    ax.scatter(grp['recency'], grp['monetary'], label=sname, alpha=0.5, s=15, c=c)
ax.set_xlabel('Recency (days since last purchase)')
ax.set_ylabel('Total Spend (£)')
ax.set_title('Customer Segments: Recency vs Monetary Value')
ax.legend(); ax.grid(alpha=0.2)
plt.tight_layout()
plt.show()

print("\nSegment distribution:")
print(rfm['segment_name'].value_counts().to_string())
Segment profiles:
         recency  frequency  monetary  count
segment
1           25.2       31.0    6741.7    187
3           98.4       17.5    2463.6    349
0           97.4        7.9     516.5    888
2          397.9        2.5      74.8    576
/Volumes/MacSSD/01_Projects/Chandravesh-ML-Research/projects/jupyter-books/.venv/lib/python3.10/site-packages/sklearn/utils/extmath.py:203: RuntimeWarning: divide by zero encountered in matmul
  ret = a @ b
/Volumes/MacSSD/01_Projects/Chandravesh-ML-Research/projects/jupyter-books/.venv/lib/python3.10/site-packages/sklearn/utils/extmath.py:203: RuntimeWarning: overflow encountered in matmul
  ret = a @ b
/Volumes/MacSSD/01_Projects/Chandravesh-ML-Research/projects/jupyter-books/.venv/lib/python3.10/site-packages/sklearn/utils/extmath.py:203: RuntimeWarning: invalid value encountered in matmul
  ret = a @ b
/Volumes/MacSSD/01_Projects/Chandravesh-ML-Research/projects/jupyter-books/.venv/lib/python3.10/site-packages/sklearn/cluster/_kmeans.py:237: RuntimeWarning: divide by zero encountered in matmul
  current_pot = closest_dist_sq @ sample_weight
/Volumes/MacSSD/01_Projects/Chandravesh-ML-Research/projects/jupyter-books/.venv/lib/python3.10/site-packages/sklearn/cluster/_kmeans.py:237: RuntimeWarning: overflow encountered in matmul
  current_pot = closest_dist_sq @ sample_weight
/Volumes/MacSSD/01_Projects/Chandravesh-ML-Research/projects/jupyter-books/.venv/lib/python3.10/site-packages/sklearn/cluster/_kmeans.py:237: RuntimeWarning: invalid value encountered in matmul
  current_pot = closest_dist_sq @ sample_weight
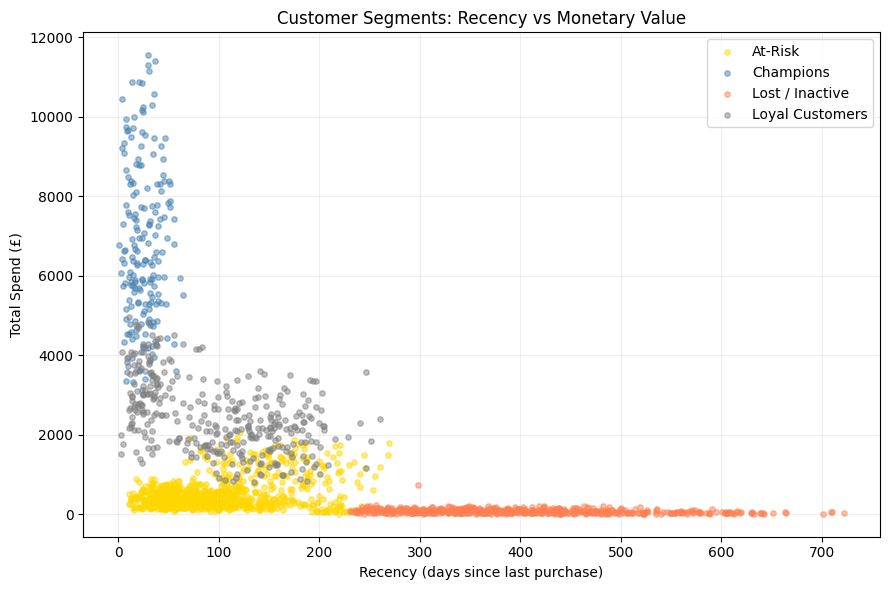
Segment distribution:
segment_name
At-Risk            888
Lost / Inactive    576
Loyal Customers    349
Champions          187
4. KNN Similarity Search — Find Look-alike Customers
Given a high-value customer (a “Champion”), find the most similar customers from the “At-Risk” group to target with a win-back campaign.
%matplotlib inline
import numpy as np
import pandas as pd
import matplotlib.pyplot as plt
from sklearn.neighbors import NearestNeighbors

# Build a Ball Tree on At-Risk customers
at_risk = rfm[rfm['segment_name'] == 'At-Risk'].copy()
X_at_risk = scaler.transform(at_risk[['recency', 'frequency', 'monetary']].values)

nn = NearestNeighbors(n_neighbors=5, algorithm='ball_tree', metric='euclidean')
nn.fit(X_at_risk)

# Query: top 3 Champions by monetary value
champions = rfm[rfm['segment_name'] == 'Champions'].nlargest(3, 'monetary')
X_champ = scaler.transform(champions[['recency', 'frequency', 'monetary']].values)

distances, indices = nn.kneighbors(X_champ)

print("Top-3 Champions and their 5 most similar At-Risk customers:")
for i, (_, champ_row) in enumerate(champions.iterrows()):
    print(f"\nChampion {i+1}: R={champ_row['recency']}d  F={champ_row['frequency']}  M=£{champ_row['monetary']:.0f}")
    print(f"  5 nearest At-Risk customers (scaled distances: {np.round(distances[i], 2)}):")
    for j, idx in enumerate(indices[i]):
        row = at_risk.iloc[idx]
        print(f"    [{j+1}] Customer {row['customer_id']:4d}: R={row['recency']}d  F={row['frequency']}  M=£{row['monetary']:.0f}  dist={distances[i][j]:.3f}")
Top-3 Champions and their 5 most similar At-Risk customers:

Champion 1: R=29d  F=38  M=£11546
  5 nearest At-Risk customers (scaled distances: [5.6  5.6  5.64 5.64 5.66]):
    [1] Customer  642: R=108d  F=11  M=£1899  dist=5.600
    [2] Customer  896: R=121d  F=10  M=£2069  dist=5.604
    [3] Customer 1544: R=71d  F=10  M=£1919  dist=5.640
    [4] Customer  123: R=98d  F=12  M=£1628  dist=5.644
    [5] Customer 1395: R=118d  F=10  M=£1925  dist=5.659

Champion 2: R=36d  F=39  M=£11400
  5 nearest At-Risk customers (scaled distances: [5.6  5.61 5.64 5.65 5.66]):
    [1] Customer  642: R=108d  F=11  M=£1899  dist=5.602
    [2] Customer  896: R=121d  F=10  M=£2069  dist=5.608
    [3] Customer  123: R=98d  F=12  M=£1628  dist=5.642
    [4] Customer 1544: R=71d  F=10  M=£1919  dist=5.645
    [5] Customer 1395: R=118d  F=10  M=£1925  dist=5.662

Champion 3: R=29d  F=39  M=£11310
  5 nearest At-Risk customers (scaled distances: [5.57 5.58 5.61 5.61 5.63]):
    [1] Customer  642: R=108d  F=11  M=£1899  dist=5.570
    [2] Customer  896: R=121d  F=10  M=£2069  dist=5.577
    [3] Customer  123: R=98d  F=12  M=£1628  dist=5.609
    [4] Customer 1544: R=71d  F=10  M=£1919  dist=5.612
    [5] Customer 1395: R=118d  F=10  M=£1925  dist=5.631
%matplotlib inline
import numpy as np
import pandas as pd
import matplotlib.pyplot as plt
# Segment-level business metrics
seg_metrics = rfm.groupby('segment_name').agg(
n_customers=('customer_id', 'count'),
avg_recency=('recency', 'mean'),
avg_frequency=('frequency', 'mean'),
avg_monetary=('monetary', 'mean'),
total_revenue=('monetary', 'sum')
).round(1)
seg_metrics['revenue_share_%'] = (seg_metrics['total_revenue'] / seg_metrics['total_revenue'].sum() * 100).round(1)
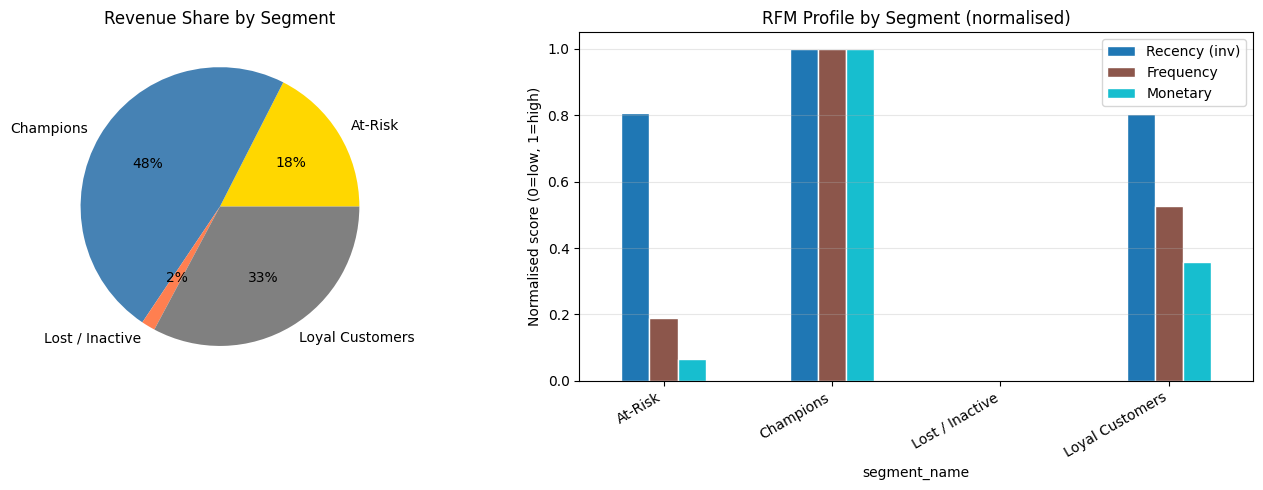
print("Business metrics by segment:")
print(seg_metrics.to_string())
# Radar / bar chart comparison
fig, axes = plt.subplots(1, 2, figsize=(14, 5))
# Revenue share pie
axes[0].pie(seg_metrics['revenue_share_%'],
labels=seg_metrics.index,
autopct='%1.0f%%',
colors=['gold','steelblue','coral','gray'])
axes[0].set_title('Revenue Share by Segment')
# Average RFM bar chart (normalised)
from sklearn.preprocessing import MinMaxScaler
rfm_means = seg_metrics[['avg_recency','avg_frequency','avg_monetary']].copy()
# Invert recency so higher = better (lower days)
rfm_means['avg_recency'] = rfm_means['avg_recency'].max() - rfm_means['avg_recency']
mms = MinMaxScaler()
rfm_norm = pd.DataFrame(mms.fit_transform(rfm_means), index=rfm_means.index, columns=['Recency (inv)','Frequency','Monetary'])
rfm_norm.plot(kind='bar', ax=axes[1], colormap='tab10', edgecolor='white')
axes[1].set_xticklabels(rfm_norm.index, rotation=30, ha='right')
axes[1].set_ylabel('Normalised score (0=low, 1=high)')
axes[1].set_title('RFM Profile by Segment (normalised)')
axes[1].grid(alpha=0.3, axis='y')
axes[1].legend(loc='upper right')
plt.tight_layout()
plt.show()
Business metrics by segment:
                 n_customers  avg_recency  avg_frequency  avg_monetary  total_revenue  revenue_share_%
segment_name
At-Risk                  888         97.4            7.9         516.5       458685.2             17.5
Champions                187         25.2           31.0        6741.7      1260695.9             48.1
Lost / Inactive          576        397.9            2.5          74.8        43080.4              1.6
Loyal Customers          349         98.4           17.5        2463.6       859802.5             32.8
5. Try It in the Browser
Compute RFM scores and segment label for a small customer set.
def rfm_score(customers):
    # customers: list of dicts with recency, frequency, monetary
    # Simple thresholds for demo
    segments = []
    for c in customers:
        r, f, m = c['recency'], c['frequency'], c['monetary']
        if r <= 30 and f >= 10 and m >= 500:
            seg = 'Champion'
        elif r <= 90 and f >= 5:
            seg = 'Loyal'
        elif r > 180 and m >= 200:
            seg = 'At-Risk'
        else:
            seg = 'Lost'
        segments.append({'id': c['id'], 'segment': seg, 'R': r, 'F': f, 'M': m})
    return segments

customers = [
    {'id': 101, 'recency': 5,   'frequency': 25, 'monetary': 1200},
    {'id': 102, 'recency': 15,  'frequency': 8,  'monetary': 400},
    {'id': 103, 'recency': 200, 'frequency': 12, 'monetary': 600},
    {'id': 104, 'recency': 300, 'frequency': 2,  'monetary': 80},
    {'id': 105, 'recency': 45,  'frequency': 6,  'monetary': 300},
]
for c in rfm_score(customers):
    print(f"Customer {c['id']:3d}: R={c['R']:3d}d  F={c['F']:2d}  M=£{c['M']:4d}  → {c['segment']}")
Knowledge Check
In the RFM framework, a customer with R=5, F=30, M=2000 is most likely classified as:
CheckWhy must you apply StandardScaler to RFM features before KNN similarity search?
CheckExercises
Exercise 1 — Optimal K for Segmentation
Re-run the K-Means elbow + silhouette analysis for K ∈ [2, 10]. Does the optimal K change? Describe what business segments correspond to K=3 vs K=5.
Exercise 2 — KNN-Based Recommendations
For each “Potential Loyalist” customer, find the 3 nearest “Champion” customers. Compute the average monetary value of those Champions. Use this as a “revenue potential score” — rank Potential Loyalists by this score.
Exercise 3 — Alternative Distance Metrics
Re-run the segmentation KNN similarity search with metric='manhattan' and metric='chebyshev'. Do the neighbours change? Which metric groups customers more by recency vs monetary value?
%matplotlib inline
# Exercises 1, 2, 3 — your code here
from sklearn.neighbors import NearestNeighbors
from sklearn.cluster import KMeans
from sklearn.metrics import silhouette_score
# Your code here
Common Pitfalls
Summary
RFM analysis converts raw transaction history into three interpretable features: Recency, Frequency, Monetary.
K-Means clusters RFM-scaled customers into behavioural segments; silhouette score selects the optimal K.
KNN similarity search on scaled RFM finds look-alike customers for targeting (e.g., Champions similar to At-Risk for win-back campaigns).
Ball Tree (
NearestNeighbors(algorithm='ball_tree')) provides efficient exact NN search for the segmentation dataset size.Always scale RFM features before any distance-based computation (KNN or K-Means).
Segment names must be derived from profiles, not arbitrary cluster labels.

What’s Next — Decision Trees
You have completed the KNN chapter. The next chapter introduces tree-based models — a fundamentally different approach that partitions feature space by axis-aligned splits, is scale-invariant, and naturally handles non-linear interactions and mixed feature types. Decision Trees are the building block for the most powerful ensemble methods: Random Forests and Gradient Boosting.
Proceed to decision_trees.ipynb.